Data Dashboards
PHPP Strategic Direction
Community Health Planning

Public Health, Policy & Planning (PHPP) has begun the process of producing a strategic plan that is focused on improving the health outcomes of those who live, work, learn, and play in San Mateo County. The first step of the strategic planning process, the Community Health Assessment (CHA), has concluded. This process included a summary of health status data presented to community members at multiple forums held throughout San Mateo County in English and in Spanish. The second step, Community Health Improvement Plan (CHIP) is actively in progress. The CHIP Kick-off held on November 1, 2023 and included community partners along with PHPP staff. The Kick-Off included a prioritization process to identify health areas to include in the CHIP. The next step is start of the CHIP working groups to develop health improvement plans for the three health areas that will be the focus of the 2024-2026 CHIP.
CHIP Overall Work Group Updates
CHIP Work Group Co-Leads Overview
CHIP Work Group Progress as of February 9, 2024
CHIP Work Group Progress as of December 2024
CHIP Work Group Progress as of June 2025
CHIP Work Group Progress as of December 2025

Community Health Improvement Plan (CHIP)
Step two: Read the Community Health Improvement Plan (CHIP) for San Mateo County 2024-2026 
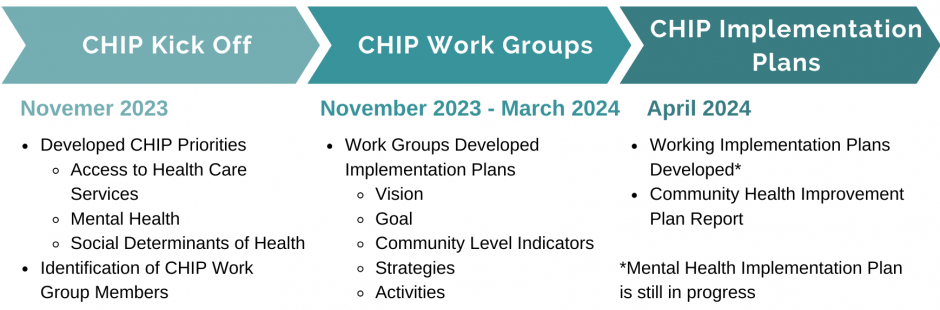
The Community Health Improvement Plan (CHIP) describes how San Mateo County Health and community partners will work towards a shared vision to improve health and advance health equity in San Mateo County. The plan is a result of a seven-month assessment and planning process engaging more than 90 partners, including representatives from the San Mateo County Health, community-based organizations, behavioral health, hospitals, health plans, and community advocates and leaders. The plan considers findings from the county’s most recent community health assessment and outlines objectives and strategies for collective action for the three selected priority areas. This is the first CHIP for San Mateo County; however, partners have previously collaborated on multiple assessments and plans which have informed our collaborative efforts. Please see timeline below:
CHIP Timeline
CHIP Work Group Members
Click on any of the three work group lists below to view members.
Access to Health Care Work Group Members
Meets every 2nd Wednesday of the month from 9-10:30 a.m. via Zoom. To join workgroup or more information, contact: Jiana Riguera at jriguera@smcgov.org.
Community Leads: Dr. Chris Esguerra | Health Plan of San Mateo,
Ana Avendano | El Concilio of San Mateo County
Health Lead: Sonali Suratkar | San Mateo County Health, Health Equity, Policy, & Planning
Members:
| Alexandria Blacker | Stanford University |
| Dr. Anand Chabra | San Mateo County Health, Family Health |
| Corina Chung | San Mateo County Health, Office of Epidemiology and Evaluation |
| Elizabeth Campos | Peninsula Family Service |
| Fatima Rodriguez | Peninsula Health Care District |
| Gladys Melghem | San Mateo County Health, Edison & Mobile Clinics |
| Dr. Jack Nassar | San Mateo County Health, San Mateo Medical Center |
| Jonathan Shaw | Stanford University |
| Judith Guerrero | Coastside Hope |
| Julie Shanson | Belle Haven Action |
| Dr. Kismet Baldwin-Santana | San Mateo County Health |
| Lisa Tealer | Bay Area Community Health Advisory Council (BACHAC) |
| Luarnie Bermudo | Health Plan of San Mateo |
| Melieni Talakai | San Mateo County Health, Edison & Mobile Clinics |
| Petra Silton | Thrive Alliance |
| Q Smith | Community Member |
| Richard Moore | Health Plan of San Mateo |
| Sandi Winter | Sr. Coastsiders |
| Serena Deverich | San Mateo County Health, Edison & Mobile Clinics |
| Stephanie Smith | Community Member |
Mental Health Work Group Members
Meets every 3rd Thursday of the month from 9-10:30 a.m. via Zoom. To join workgroup or more information, contact: Jiana Riguera at jriguera@smcgov.org.
Community Lead: Luci Latu | Taulama for Tongans
Health Lead: Edith Cabuslay | San Mateo County Health, Behavioral Health & Recovery Services
Members:
| Ana Avendano | El Concilio of San Mateo County |
| Andres Romero | YMCA |
| Brenda Nuñez | Star Vista |
| Cameron Zeller | Community Member |
| Cassandra Jackson | BACHAC |
| Chris Thibodeaux | San Mateo County Health, Edison & Mobile Clinics |
| Dr. Curtis Chan | San Mateo County Health |
| Donna Collins Williams | Stanford University |
| Doris Estremera | San Mateo County Health, Behavioral Health and Recovery Services |
| Gladys Balmas | San Mateo County Health, Aging and Adult Services |
| Jackie Alms | Peninsula Health Care District |
| Ja’Net Lawrence | One EPA |
| Karen Pfister | San Mateo County Health, Office of Epidemiology and Evaluation |
| Kique Bazan | Ayudando Latinos A Soñar (ALAS) |
| Leafa Taumoepeau | Taulama For Tongans |
| Luci Latu | Taulama For Tongans |
| Maria Lorente-Foresti | San Mateo County Health, Behavioral Health and Recovery Services |
| Rai Abileah | ALAS |
| Sharon Dipierro | Ravenswood Family Health Center |
| Shawneece Stevenson | BACHAC |
| Silvie Arabia | San Mateo County Health, Family Health |
Social Determinants of Health Work Group Members
Meets every 1st Thursday of the month from 9-10:30 a.m. via Zoom. To join workgroup or more information, contact: Jiana Riguera at jriguera@smcgov.org.
Community Lead: Rafael Avendano | Redwood City Together
Health Lead:TBD Members:
| Alex Golding | San Mateo County Pride |
| Alex Navaro | Second Harvest |
| Amy Scribner | Health Plan of San Mateo |
| Briana Evans | City of Redwood City |
| Chris Bernhardt | Novaworks |
| Dr. Curtis Chan | San Mateo County Health |
| Dr. David Chang | Stanford University |
| Deandra Lee | San Mateo County Health, Health Equity, Policy & Planning |
| Georgia Farooq | Thrive Alliance |
| Heather Eastwood | San Mateo County Health, Office of Epidemiology and Evaluation |
| Janine Bruce | Stanford University |
| Kacie Patton | San Mateo County Health, San Mateo Medical Center |
| Klealy Pineda-Mena | San Mateo County Health, San Mateo Medical Center |
| Maria Reyes | San Mateo County Health, Communicable Disease Control & Prevention |
| Marion Brown | BACHAC |
| Marlen Medina | El Concilio of San Mateo |
| Dr. Miriam Sheinbein | Health Plan of San Mateo |
| Rachel Monaco | Second Harvest of Silicon Valley |
| Ruben Abrica | City of EPA |
| Tamta Mchedlisvili | San Mateo County Health, Communicable Disease Control & Prevention |
| Vicky Avila Medrano | Peninsula Family Service |
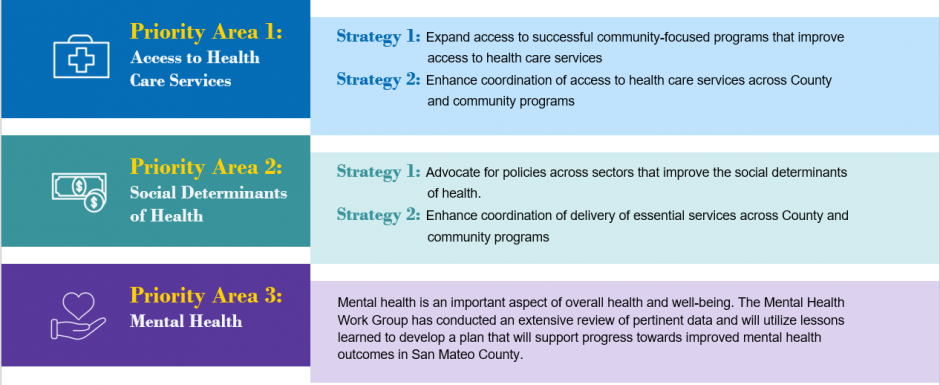
CHIP Work Group Priority Areas
The CHIP work groups have worked on the three priority areas: Access to Health Care Services (Access), Social Determinants of Health (SDOH), and Mental Health. The work groups are responsible for developing the vision, goal, community-level indicators, strategies, objectives, and activities for each priority area. Below is a high-level overview of the strategies developed for Access and SDOH.
What is the Community Health Improvement Plan (CHIP)?
The Community Health Improvement Plan (CHIP) for San Mateo County 2024-2026 outlines key objectives and strategies to address determinants of health that will lead to improvements in health outcomes. It serves as a roadmap for improving population health and keeping community health planning visible to decision-makers and community members. It lays out the strategic effort to address health issues based on data results of the CHA and the CHA Community Forums.
Why is the CHIP important?
The CHIP is intended to be a partnership between Public Health, Policy & Planning (PHPP) and community stakeholders. It is critical to addressing health needs identified in the CHA. The priorities, goals, objectives, and strategies developed are determined with community input. The CHIP increases community collaboration and strengthens partnerships to address health needs.
Frequently Asked Questions
What is a Community Health Assessment (CHA)?
The Community Health Assessment (CHA) is a report that highlights data gathered on the health status of San Mateo County residents. For San Mateo County, most data in the CHA comes from the Health and Quality of Life survey. This survey is important because it is not limited to physical health measures but also captures information on factors that influence health. The factors include, but are not limited to: affordable housing, childcare, education, employment, air and water quality, civic participation, neighborhood safety, access to health care services, physical activity, etc.
Why is the CHA important?
The data reported in the CHA will be used to identify health needs and priorities. The survey collected data from over 3,000 adults and included over sampling of key populations (for example, Latinos, African Americans, Pacific Islander, LGBTQ+ individuals, low-income populations, and individuals from the coast). The data set is more comprehensive than other sources of data for San Mateo County; therefore, it is an excellent source of information to make data-driven decisions. The CHA is part of a broader community engagement process to identify and implement health improvement activities.
Why should I attend the CHA Community Forum?
You should attend the forum to provide input on your community’s health needs and priorities. This is the first step in developing the Community Health Improvement Plan (CHIP). It is important to have a strong community voice in this planning process. This also provides the opportunity to hear directly from community members on health needs that might not be highlighted in the CHA that should be considered in developing the CHIP.
Should I go to more than one CHA Community Forum?
No, the forums are being repeated in different areas of the county to make it easy for people to attend. The information and process for getting feedback will be the same at each forum, so there is no need to attend more than one.
What should I expect at the CHA Community Forum?
You should expect the following:
- An overview and summary of data from the Health and Quality of Life Survey and other sources
- An opportunity to share information about your health or the health of your community that may not have been highlighted in the data.
- You will be asked to choose health needs that should be the priority focus for health improvement for the next three years.
Dinner will be provided at the forum, and community members will be given a $25 gift card for their participation.
What will happen after the CHA Community Forums?
After the community forums, the information and health priority recommendations shared at all forums will be compiled to determine health priorities for the Community Health Improvement Plan (CHIP). A Community Health Improvement Plan kick-off meeting will be held to review the priorities identified at the CHA forums and determine three health priorities for the Community Health Improvement Plan.
Goals
The goals for this process include:
- Developing and improving engagement with community members to identify and guide health priorities
- Communicating and seeking feedback on the strategic planning process from internal and external partners
- Creating an actionable strategic plan that will lead to improved health outcomes
- Establishing a meaningful partnership with community for strategic planning and shared decision-making
Process
PHPP has a three-step process to develop the PHPP strategic direction for the next three years. Those steps include:
Community Health Assessment (CHA) – Step One:
The CHA was developed using the Health and Quality of Life survey. Over 3,000 San Mateo County adults completed the survey with over sampling of key populations (for example, Latinos, African Americans, Pacific Islander, LGBTQ+ individuals, low-income populations, and individuals from the coast). The data set is more comprehensive than other sources of data for San Mateo County. PHPP will present a summary of the CHA data that highlights San Mateo County’s health status and needs to seek community feedback. Six CHA Community Forums will be held throughout the county (four English and two Spanish) to gather community feedback on the data. This is also an opportunity for community members to share their experience related to health needs that are included in the CHA data.
Community Health Improvement Plan (CHIP) – Step Two:
In collaboration with community members, community partners organizations, and PHPP staff, the CHIP will highlight prioritized health concerns and outline strategies for health improvement action. The CHIP will consist of a virtual prioritization session that will result in no more than three health priorities. Workshops will be held for each identified health priority. The workshops will result in the development of goals, objectives, and strategies for each health priority. Once the priorities are identified, a CHIP steering committee will be developed to help in the development of the CHIP. The committee will consist of subject matter experts on the health priorities identified, community stakeholders, and PHPP staff. A CHIP implementation plan will be developed to monitor, review, and update progress on the CHIP goals with community stakeholders.
PHPP Strategic Plan – Step Three:
The PHPP Strategic Plan is an internal plan that is guided by community input through the CHA and CHIP. The CHIP will most likely include health priorities that are not under the direct scope of PHPP programs (i.e., mental health, maternal and child health, older adult health, etc.). Therefore, the CHIP will be considered in providing context for overall health improvement whereas, the PHPP strategic plan will serve as our operational workplan. The strategic plan will outline PHPP’s mission, vision, and values. It will also consist of PHPP priorities, goals, and strategies specific to the work and scope of the division’s programs. The plan is intended to engage all levels of PHPP for input, feedback, and plan development. The plan will be developed utilizing multiple opportunities for input including but not limited to an in-person kick off session, key informant interviews, virtual listening sessions, and a staff survey. Once the plan is developed a schedule will be created to monitor, review, and share progress on the PHPP plan as well as make adjustments to the plan goals and objectives as needed.
Timeline
Proposed timeline of PHPP Strategic Direction activities can be found below:
| Step One | CHA Community Forum | Sept. – Oct. 2023 |
| Step Two | CHIP Development | Nov. 2023 – Mar. 2024 |
| Step Three | CHIP Implementation and Updates | Mar. 2024 – Dec. 2026 |
CHA Forum: 9/12/23
 At the September 12, 2023 CHA Forum in San Mateo, community members, San Mateo County Health Public Health, Policy & Planning (PHPP) in partnership with Bay Area Community Health Advisory Council (BACHAC) came together to discuss the health needs those living in San Mateo County. Twelve (12) community members attended the meeting, and the following are the key health issues identified:
- The need to address food insecurity
- Improved access to supportive services for vulnerable populations including older adults
- Housing needs
CHA Forum: 9/20/23
 At the September 20, 2023 CHA Forum in Half Moon Bay, community members, San Mateo County Health Public Health, Policy & Planning (PHPP) in partnership with Senior Coastsiders came together to discuss the health needs those living in San Mateo County. Twelve (12) community members attended the meeting, and the following are the key health issues identified:
- Access to health care services
- Transportation
- Mental health and isolation
CHA Forum: 9/24/23
 At the September 24, 2023 CHA Forum in Daly City, community members, San Mateo County Health Public Health, Policy & Planning (PHPP) in partnership with Healthways came together to discuss the health needs those living in San Mateo County. Thirty-six (36) community members attended the meeting, and the following are the key health issues identified:
- Mental health
- Environmental impacts on health (crime, pest infestation, toxic soil)
- Diabetes and obesity
CHA Forum: 10/2/23
 At the October 2, 2023 CHA Forum in East Palo Alto, community members, San Mateo County Health Public Health, Policy & Planning (PHPP) in partnership with One EPA (East Palo Alto) came together to discuss the health needs those living in San Mateo County. Eighteen (18) community members attended the meeting, and the following are the key health issues identified:
- Mental health
- Diabetes and obesity
- Housing
CHA Forum: 10/10/23
 At the October 10, 2023 CHA Forum (Spanish) in Redwood City, community members, San Mateo County Health Public Health, Policy & Planning (PHPP) in partnership with El Concilio came together to discuss the health needs those living in San Mateo County. Twenty (20) community members attended the meeting, and the following are the key health issues identified:
- Diabetes and obesity
- Housing
- Nutrition/food insecurity
CHA Forum: 10/11/23
 At the October 11, 2023 CHA Forum (Spanish) in Redwood City, community members, San Mateo County Health Public Health, Policy & Planning (PHPP) in partnership with Coastside Hope came together to discuss the health needs those living in San Mateo County. Eleven (11) community members attended the meeting, and the following are the key health issues identified:
- Access to health care services
- Discrimination/culturally appropriate care/trust
- Housing
CHA Forum: 10/19/23
At the October 19, 2023 CHA Forum (virtual) in Redwood City, community members, San Mateo County Health Public Health, Policy & Planning (PHPP) in partnership with Youth Community Service came together to discuss the health needs those living in San Mateo County. Forty-six (46) community members attended the meeting, and the following are the key health issues identified:
- Mental health
- Discrimination
- Access to health care services
CHA Forum Data Q&A
Do you have more data than what was presented at the community forums?
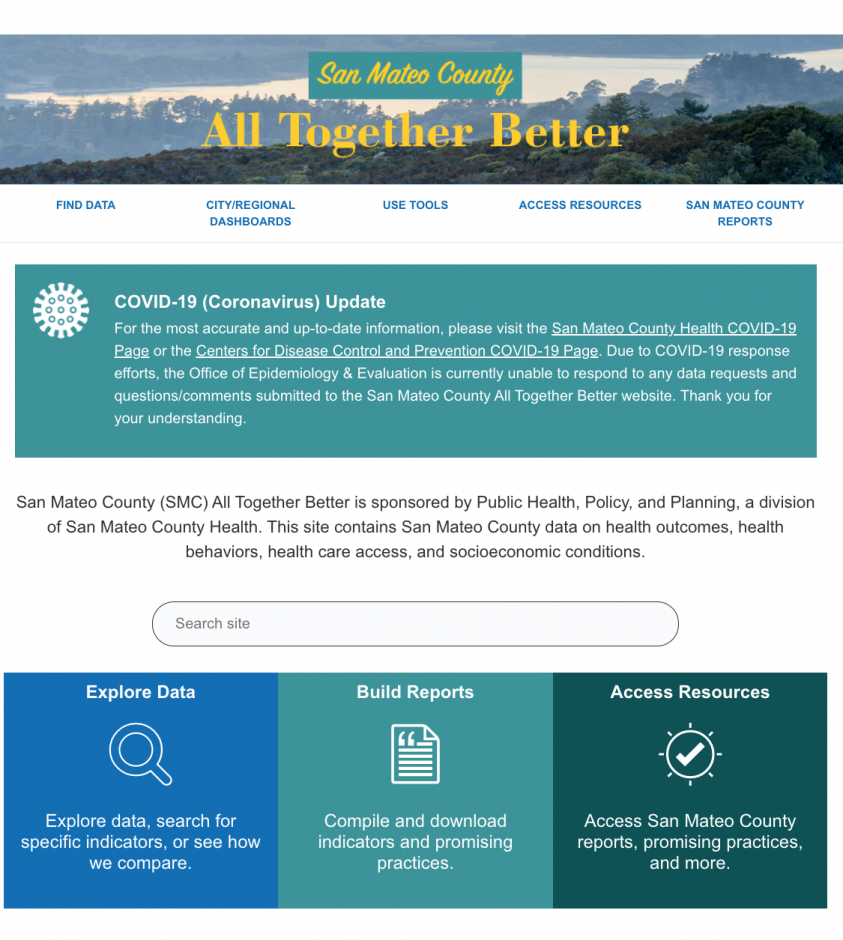
To find more data on different communities or health topics, you can explore the San Mateo County All Together Better (SMCATB) data portal. The data portal is sponsored by Public Health, Policy, and Planning (PHPP). This site contains San Mateo County data on health outcomes, health behaviors, health care access, and socioeconomic conditions. Indicators are disaggregated by age, sex, race/ethnicity, and/or geography. You can also view reports, including the 2023 Community Health Needs Assessment: Health & Quality of Life in San Mateo County. PHPP will also be publishing additional data briefs and uploading new indicators to the SMCATB data portal in 2024.
How many people live in San Mateo County?
According to 2023 Claritas data, there are 740,014 residents living in San Mateo County. For more population data, visit the Demographics Dashboard on the San Mateo County All Together Better data portal.
What is the Healthy Places Index?
Developed by the Public Health Alliance of Southern California, the Healthy Places Index (HPI) maps socioeconomic factors that impact life expectancy and other health conditions. A score is calculated based on 23 different indicators for various geographies including counties, zip codes, and census tracts. Scores range from 1 to 100, where lower scores indicate less healthy conditions and higher scores indicate healthier conditions. Various San Mateo County initiatives have used the HPI to guide programs and policies toward health equity-driven goals, including selecting neighborhoods for COVID testing and vaccination outreach and identifying priority neighborhoods for the Community Health Assessment.
CHIP Kick-Off: 11/1/23
The virtual CHIP kick-off event was held on 11/1/23, here’s a recap:
We had representatives from over 90 CBO partners and non-profit organizations, Hospitals (Kaiser, Sequoia, Stanford) and Health Plan of San Mateo, members of San Mateo County Health Programs (e.g., Behavioral Health & Recovery Services, Family Health, Public Health, San Mateo Medical Center), and community advocates and leaders.
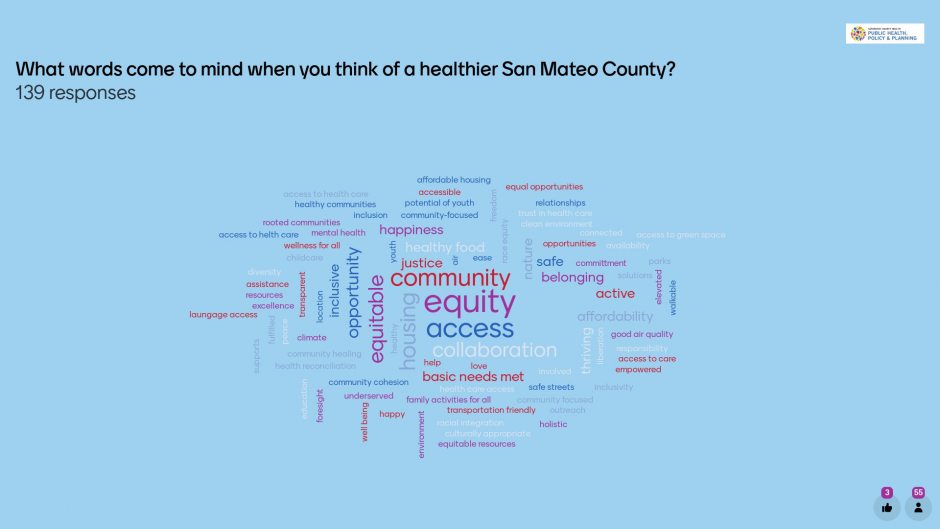
The meeting was grounded with an activity to identify a shared vision and values. (please click images to enlarge)
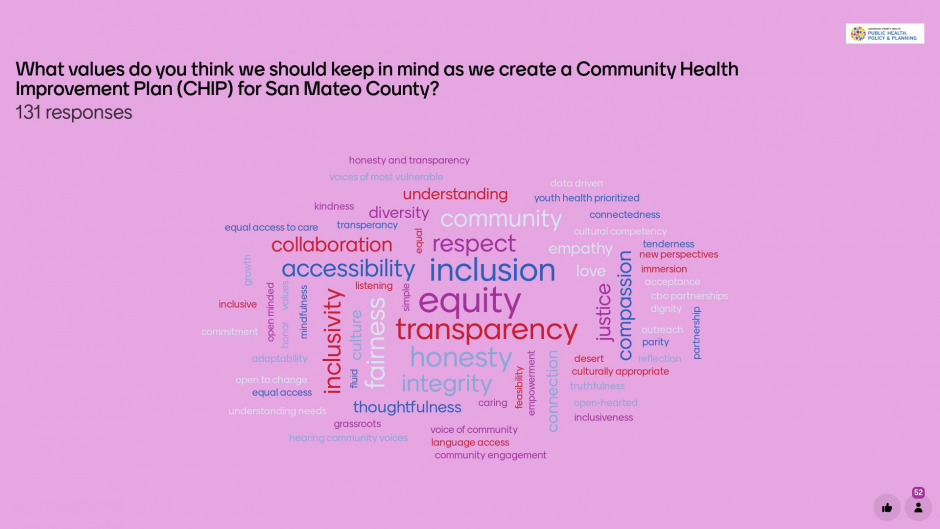
The purpose of the Community Health Improvement Plan (CHIP) Kick-Off was to highlight findings from the Community Health Assessment (CHA), the CHA Community Forums, and the resulting list of nine health priority areas that were created via this process. Based on the health areas identified during the CHA forums, attendees were asked to prioritize the list to develop the top five priorities for consideration in implementing the 2024-2026 CHIP.  The five health priorities identified include: Mental Health & Mental Disorders, Access to Health Care Services, Social Determinants of Health (SDOH) (Economy, Housing, Employment, Transportation), Diabetes, Substance Use (Alcohol and Drug Use, Tobacco Use). PHPP decided to focus on three health areas for the 2024-2026 CHIP. Those areas are: Mental Health & Mental Disorders, Access to Health Care Services, and Social Determinants of Health (SDOH) (Economy, Housing, Employment, Transportation).
Some participants highlight the similarities of priorities to other CHA/CHNA results. Comments in the chat included:
“We saw consistent themes with priorities across all health systems and County CHAs.”
“Based on the work that BACHAC conducted, other CHA’s showed that Mental health, economic stability, housing and homelessness, and access to care, were the top priorities.”
“I am excited for a stronger and healthier future for SMC with this great dream team/changemakers!”
See the CHIP Presentation or Watch the Kick-off Recording
Next Step
The next step in the CHIP process is that an internal steering committee will further prioritize the health areas to three areas of focus for the 2024-2026 CHIP and begin holding workgroups with community partners to co-develop a health improvement plan for the three health priorities.
Other Data
Other San Mateo County Data
|
Clicking on this link, or on the image below, will take you to the San Mateo County (SMC) All Together Better site for more data on health outcomes, health behaviors, health care access, and socioeconomic conditions in San Mateo County. This site is sponsored by Public Health, Policy, and Planning, a division of San Mateo County Health. |